

In this video Jonathon shows you how to use the EODHD Financial APIs Python Library.
00:07 — QUICK START
You’ll how our API could be used to import different types of data into the Python directly:
• Fundamental Data
• Historical Data
• Options Data
• Real-Time Market Data
• Intraday Data
• Historical Splits and Dividends
• Calendar. Upcoming Earnings, Trends, IPOs, and Splits
• Technical Indicators
• Stocks Market Screener & Stocks Market Search API
00:27 — LIBRARY INSTALLATION
The process will go through the Jupiter Notebook
Before to talk about where to pull data from, you’ll need to set up the Python Financial APIs Software Development Kit (SDK), to learn more, follow the Documentation / NO CODING. Ready-To-Go Solutions / Most Popular Financial APIs / Python Financial APIs SDK
The library requires Python 3.8+ that can be found and downloaded on GitHub
Next thing to do is to import our dependencies:
• NumPy
• Pandas
• Requests
• Datetime
• Calendar
• Scipy
• Matplotlib
import numpy as np
import pandas as pd
import requests
import datetime
import calendar
import scipy.stats as stats
import matplotlib.pyplot as plt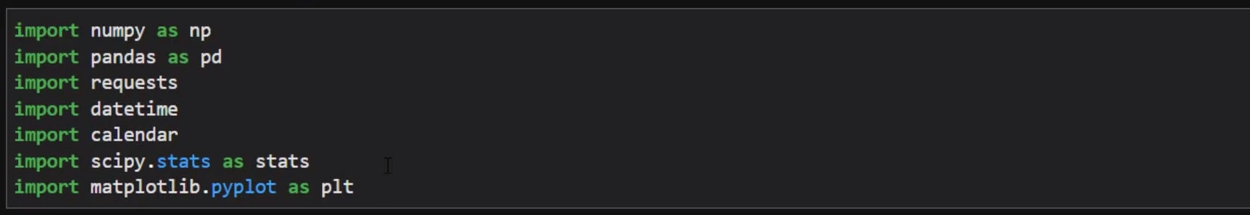
You’ll need to import the os, if you haven’t imported it yet, just make the command pip install eod, very simple.
import os
from eod import EodHistoricalData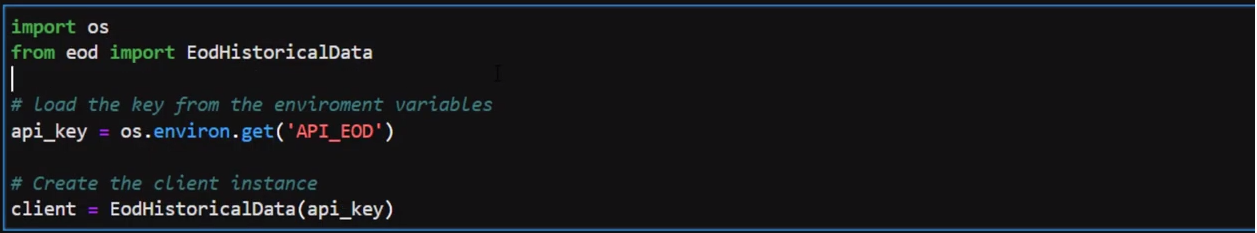
01:17 — API KEY ACTIVATION
From EODHD Library, you’ll need to import the module EODHistoricalData, the other thing that you are going to need is your API Key. Finding your API Key is super simple, you can set up an account for free, and then click on EODHD Fiancail APIs website Settings Button, which you might find, right after the Registration.
# Load the key from the environment variables
api_key = os.environ.get('API_EOD')

# or
api_key = 'your_api_key'

# Create the client instance
client = EodHistoricalData(api_key)
Holding API Keys in your environmental variable is probably the best way to do it, but for you at home if you just want to add in your api key here with text, feel free to do that too, all you need to do is pass
the API Key then in to the class EODHistoricalData and we have our client instance.
01:52 — EXHANGES OVERVIEW
We recommend you firstly to take a look at 78 exchanges that we provide, by doing:
resp = client.get_exchanges()
df = pd.DataFrame(resp)
pd.set_option('display.max_rows', len(df))
print(df)
pd.reset_option('display.max_rows')
To find symbols for a particular exchange, all you need to do is use the command:
# To Find Symbols - Request the Bombay Exchange symbols
resp = client.get_exchange_symbols(exchange='BSE')
02:22 — FINANCIAL DATA OBTAINING
You’ll know how to get Financial data statements and what type of information is available?
Well essentially in that SDK we’ve got our three financial statements on different periods.
As an exmaple let’s try to get an Australian Based Stock STO.AU, with getting the fundamental equity data annually for the balance sheet information.
symbolAU = 'STO.AU'
resp = client.get_fundamental_equity(symbolAU, filter_='Financials::Balance_Sheet::yearly')
print("STO, Annual financial reports: ", resp.keys())
You’ll see in the printing area the dictionary keys which is the dates of all these balance sheets data.
Then try to look at the US listed sock Apple AAPL.US for which you can get quarterly information based on these balance sheets, you’ll get data all the way back to 1985.
symbolUS = 'AAPL.US'
resp = client.get_fundamental_equity(symbolUS, filter_='Fianacials::Balance_Sheet::quarterly')
print("\nAAPL, Quarterly financials reports: ", resp.keys())
03:00 — EOD HISTORICAL DATA OBTAINING
Next we recomend to try on is to get the Historical End-of-Day Data, which is very comprehensive.
Let’s try it on the government 10-year yield bond SWISS.GBOND. To get the End-of-Day Prices you just need to call the function with the symbol that you’re interested in. You can also specify the date ranges that you’re interested in for example from and to:
# daily prices for the Swiss goverment bond
swiss_10yr_govbond = 'SW10Y.GBOND'
bond_prices = client.get_prices_eod(swiss_10yr_govbond, period='d', order='a')
It’s important to mention that what you’ll get back is actually a dictionary in Python, so our sdk has actually processed the JSON that’s received from the API into a dictionary format.
Therefore, you’ll need to process the dictionary into something that you want to deal with.
For example you can process data to the Pandas Data Frames, to do that:
• Use Pandas Data Frame with the dictionary you want to process.
• Set the date as the index for a lot of the time i’m looking at the closing prices
• And plott the data over time
bond_prices = pd.DataFrame(bond_prices)
bond_prices.set_index('date', inplace=True)
bond_prices.close.plot(figsize=(10,5))
plt.title('Swiss 10yr Goverment Bond Prices')
plt.ylabel('Bond Prices')
plt.show()
You’ll see a plot of the Swiss 10-year Government Bonds Prices. It has negative prices in Switzerland.
If you’ll use the same function get End-of-Day prices for the Bombay Stock Exchange BSE, then the plot prices will be looking like these.
symbol='500209.BSE'

resp = client.get_prices_eod(symbol, period='d', order='a', from_='2013-01-05')
stock_data = pd.DataFrame(resp)
stock_data.set_index('date', inplace=True)
stock_data.head()

stock_data.close.plot(figsize=(10,5))
plt.title('Bombay stock exchange (BSE): INFOSYS LTD.')
plt.show()
When we have this price series, we could do some data analysis. For the example let’s try Log Returns Distribution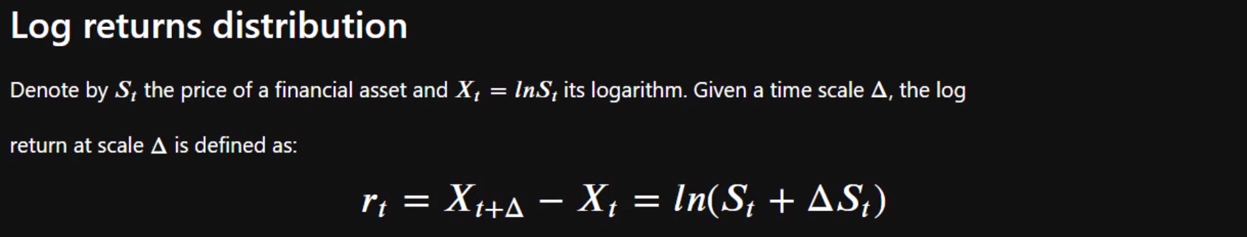
The log returns adjust the returns between a given scale of time. You’ll need to look at the daily log returns, to do that pass the data frame, specify which column you want, let it be the close and then divide it by the closed price shifted by one. It means that you going to take the close price and divide it by the previous close price. Also use the NumPy log to get the log of that change.
log_returns = np.log(stock_data.close/stock_data.close.shift(1)).dropna()
log_returns.hist(bins=100, figsize=(8,5))
plt.title('Distribution of log returns')
plt.show()
From this Log Returns Histogram you can see that it’s quite centered around zero but has some huge outliers on the left hand side, wich means massive tail risk.
Furthermore, we can do a quick statistical test. Are log returns normally distributed?
• We can plot the distribution in a Q-Q plot
• We can perform the KS (Kolmogorov-Smirnov) test
to confirm statistically whether it’s gaussian or not.
stats.probplot(log_returns, dist='norm', plot=plt)
plt.show()

ks_stat, p_value = state.kstest(log_returns, 'norm', args = (log_returns.mean(), log_returns.std()))

print(ks_stat, p_value)
if p_value > 0.05:
    print('Probably Guassian')
else:
    print('Probably NOT Guassian')
On the plot we can see again that massive left hand tail where we’re comparing the red line which is the normal distribution to our blue data observations. With a confidence interval of 99 we can say that this is probably not gaussian.
05:21 — OPTIONS DATA OBTAINING
This block is very comprehensive ti’s probably one of
the main key functions that you might find extremely useful at the EODHistorical API.
If you want any information from the past from Historical Dates, then you need to pass the from and two parameters For the example you can try to get the list of current stock options for Apple AAPL. You going to use get_stock_options (‘AAPL.US’)
resp = client.get_stock_options('AAPL.US')

iv = {}

for i in resp['data']:
iv[i['expirationDate']] = {}
iv[i['expirationDate']]['x'] = [name['strike'] for name in i['options']['CALL']]
iv[i['expirationDate']]['y'] = [name['impliedVolatility'] for name in i['options']['CALL']]

# print("Expiration Date: ", i['expirationDate'])
# print("IV vs Strikes: ", [name['impliedVolatility'] for name in i['options']['CALL']])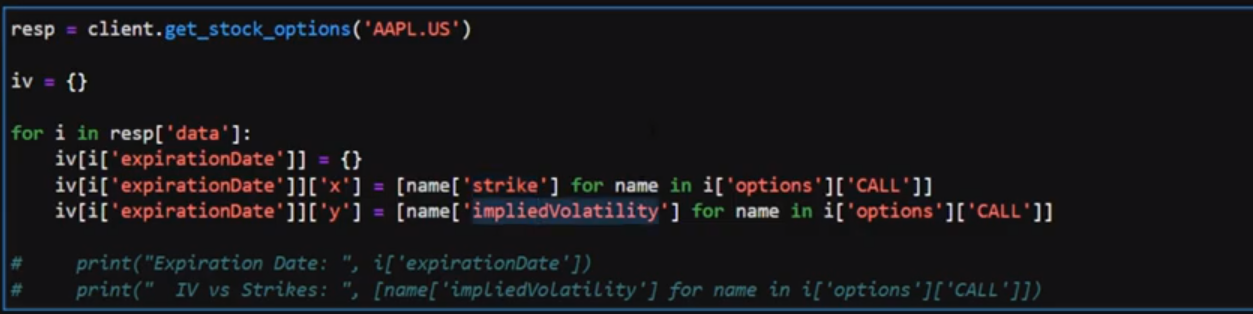
Then you’ll need to create a data frame from the response where you’ll need to get the expiration dates and to store the strikes and the implied volatility for all the call options.
Once you’ll done that, you can just plot a specific time date that you interested in and look at the implied volatility of a specific contract at an expiry with respect to the strikes.
plt.scatter(iv['2022-05-20']['x'],iv['2022-05-20']['y'])
plt.title('AAPL Implied Volatility of Contracts with 2022-05-20 Expiry')
plt.ylabel('Implied Volatility (%)')
plt.xlabel('Strike ($)')
plt.show()
You’ll find that looking at the implied volatilities that are actually offered in the market right now in the volatility smile with the EODHistoricalData API extremely valuable.
06:23 — REAL-TIME (DELAYED) DATA OBTAINING
Live (delayed) stock price API prices provided about 15 to 20 minutes delayed. You can get them with a one minute interval by:
# Multple instruments
resp = client.get_prices_live('AAL.LSE', s='GLD,QVAL,QMOM,EUR.FOREX,VTI,SW10Y.GBOND')
pd.DataFrame(resp)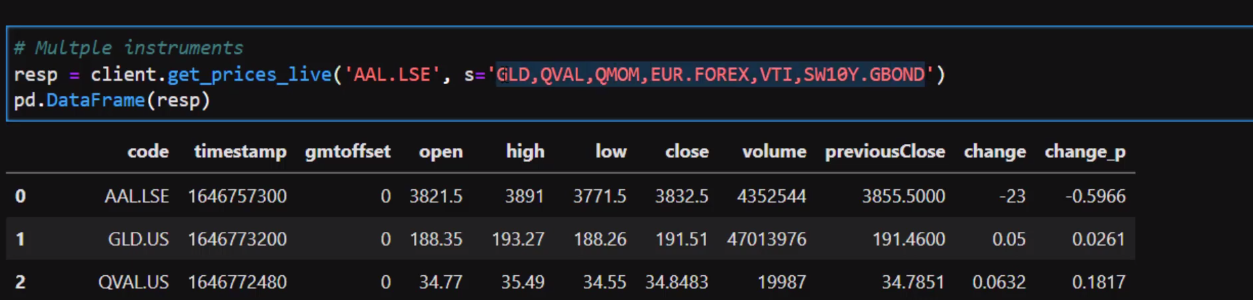
You can use multiple instruments to grab what the last open high close low volume information
was for all those symbols.
06:49 — INTRADAY DATA OBTAINING
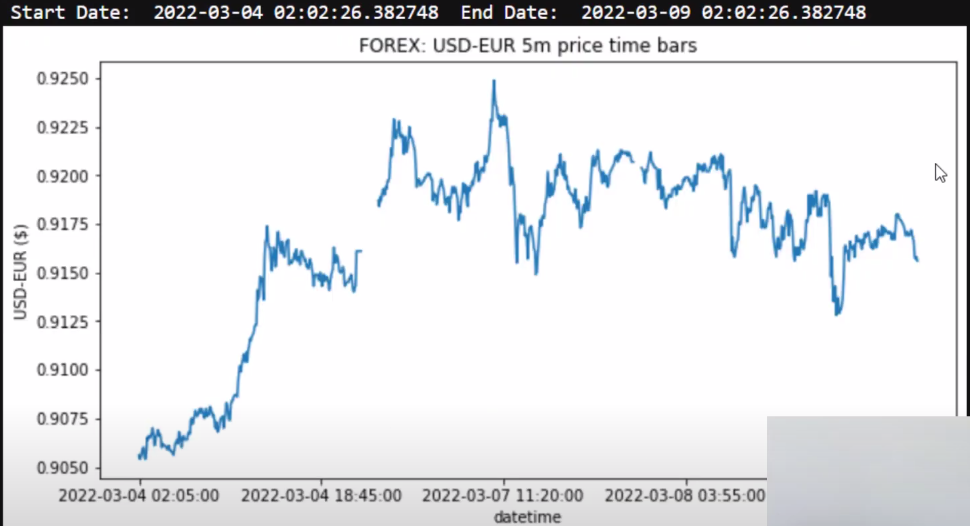
Intraday data is extremely useful as well. Let’s try to get the five minute prices for Forex USD/EUR pair.
You’ll need to get the UTC Unix date, to do that take a time delta to get start date five days ago, then convert it to the UTC Unix. You can do that using the calendar function and timegm.
end_date = datetime.datetime.utcnow()
start_date = end_date - datetime.timedelta(days=5)
utc_end_date = calendar.timegm(end_date.utctimetuple())
utc_start_date = calendar.timegm(start_date.utctimetuple())
print("Start Date: ", start_date, "End Date: ", end_date)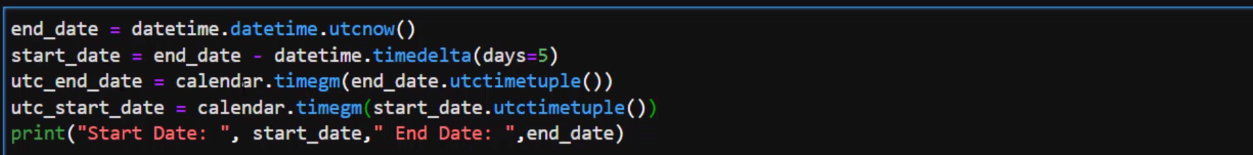
Once you’ll get done with that, use our client again to get_prices_intraday dont forget to specify the symbol, interval, from and two dates.
forex_eur = 'EUR.FOREX'
usd_eur = client.get_prices_intraday(forex_eur, interval='5m', from_=utc_start_date, to=utc_end_date)
usd_eur = pd.DataFrame(usd_eur)
usd_eur.set_index('datetime', inplace=True)
usd_eur.close.plot(figsize=(10,5))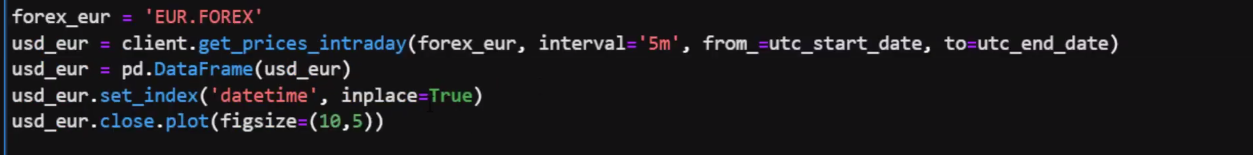
From here we can get a plot of the five minute price times with the close information for the last five days.
plt.title('FOREX: USD-EUR 5m price time bars')
plt.ylabel('USD-EUR ($)')
plt.show()
07:35 — HISTORICAL SPLITS AND DIVIDENDS DATA OBTAINING
Historical Splits and Dividend API is extremely useful as well. If you’ll need the symbol Apple AAPL again:
symbol = 'AAPL.US'
By calling the get dividends function and passing the symbol and the from date, we can get all the previous recorded dividend data for that stock:
# Get dividend data
resp = client.get_dividends('symbol', from_='2000-03-01')
dividends = pd.DataFrame(resp)
dividends.set_index('date', inplace=True)
dividends.head()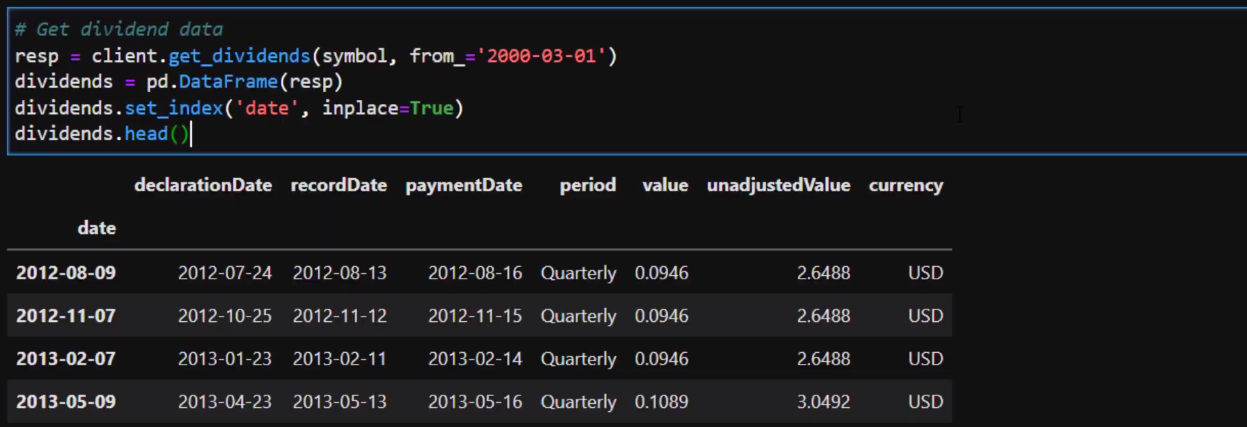
So here we can get:
• The date the declaration date
• The record date the payment date
• The value and the unadjusted value
• The currency
Getting the split information is obviously really interesting too:
For Apple AAPL you can just pass from date 1994 all the way through to 2020 and we can look at the splits that occurred in the stocks over that time.
# Get the splits for a company
resp = client.get_splits(symbol, from_='1994-01-01', to='2020-10-24')
splits = pd.DataFrame(resp)
splits.set_index('date', inplace=True)
splits.head()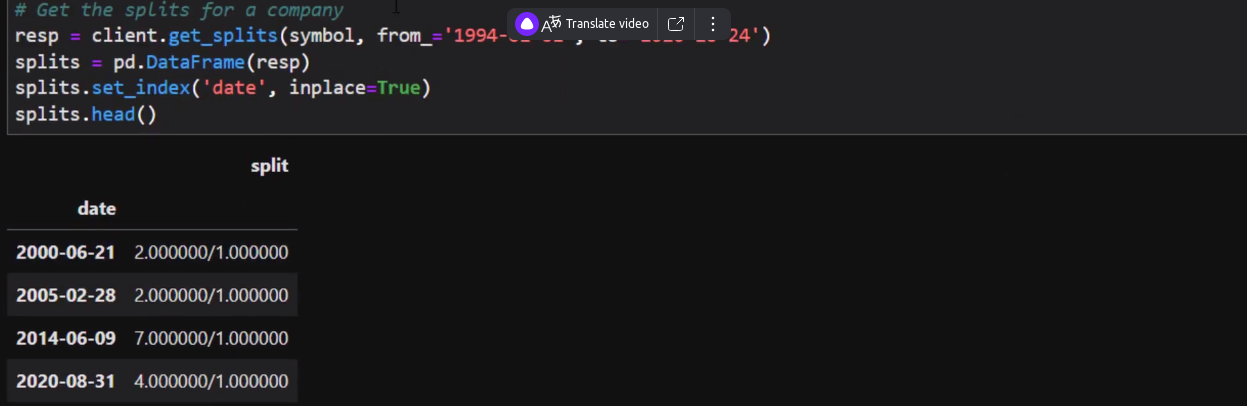
08:13 — CALENDAR FUNCTION OVERVIEW
By using it, you can look at upcoming earnings, trends. IPOs and splits
For upcoming earnings call the get_calendar_earnings function
For the earnings trends get_calendar_trends
For the IPOs get_calendar_ipos
For the splits get_calendar_splits
# Upcoming Earnings
resp = client.get_calendar_earnings(symbols='AAPL.US,MSFT.US,AI.PA', to='2023-12-01')
upcoming_Earnings = pd.DataFrame(resp)
print('\nUpcoming Earnings\n\n\n', upcoming_Earnings.head())

# Earnings Trends
resp = client.get_claendar_trends(symbols='AAPL.US,MSFT.US,AI.PA')
earnings_Trend = pd.DataFrame(resp)
print('\n\n\nEarnings Trend\n\n\n', earnings_Trend)

# Upcoming IPOs
resp = client.get_calendar_ipos(from_='2022-01-01')
upcoming_IPOs = pd.DataFrame(resp)
print('\n\n\nUpcoming IPOs\n\n\n', upcoming_IPOs)

# Upcoming Splits
resp = client.get_calendar_splits(from_='2022-01-01')
upcoming_splits = pd.DataFrame(resp)
print('\n\n\nUpcoming Splits\n\n\n', upcoming_splits.head())
You can see the examples of the data and you can use them however you want.
08:37 — TECHNICAL INDICATORS OVERVIEW
Our API also has a Technical Indicator capability whereby you can get this list of indicators.
Data directly computed for you so you don’t need to go ahead and do the computation on your side.
# Get the available indicators in the API. This method does not accept any parameter
resp = client.get_indicator_name()
resp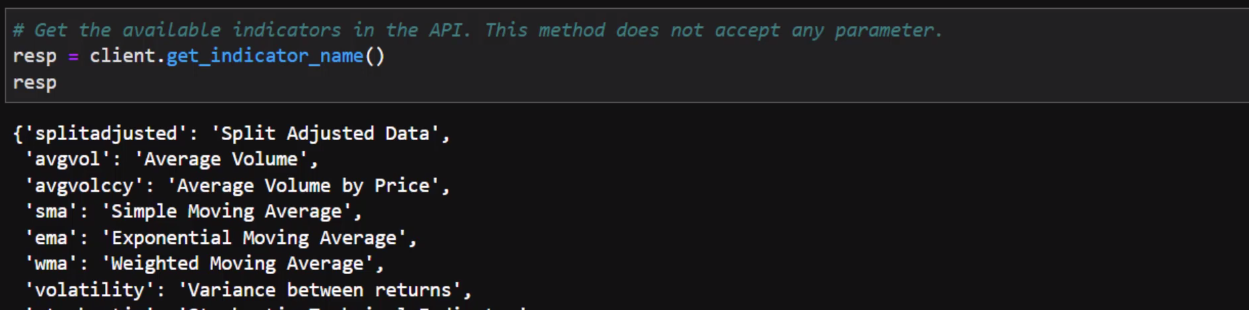
For example let’s look at the Stochastic RSI Indicator for Apple AAPL.
You could get the Apple AAPL data first for the specific time range, that you’re interested in. Then you could return the get_instrument_ta technical analysis for the symbol AAPL, call
the function stochrsi and then specify from and the to dates that aligns with my stock date:
# Get data for a specific indicator, in this case the parabolic SAR
resp = client.get_prices_eod(symbol, period='d', order='a', from_='2020-03-01', to='2021-06-30')
aapl = pd.DataFrame(resp)
aapl.set_index('date', inplace=True)

resp = client.get_instrument_ta(symbol, function='storhrsi', from_='2020-03-01', to='2021-06-30')
techinical = pd.DataFrame(resp)
techinical.set_index('date', inplace=True)

fig, axs = plt.subplots(2,1,figsize=(9,5), gridspec_kw={'height_rations': [2,1]})
axs[0].plot(aapl.close,)
axs[1].plot(techinical)
fig.legend(['close', 'fast RSI', 'slow RSI'])
fig.show()
You can create a plot with Fast RSI and Slow RSI against the Closing Price of the stock.
09:25 — STOCK SCREENER OVERVIEW
To get a list of the stock screeners available to you call:
# Request available signals
resp = client.get_screener_signals()
print(resp)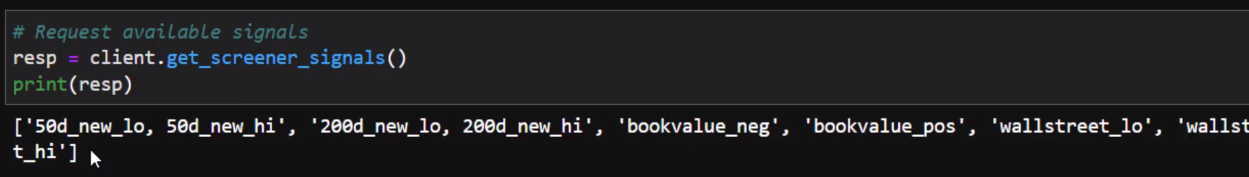
As an example you can call that function to find companies that have a new 200-day high with a price bigger than expected by the wall street analysts. To do that you’ll need to pass 200d_ new_hi,wallstreet_hi
# Request companies with a new 200 day new high and a price bigger than expected by wallstreet analysts
resp = client.get_instrument_screener(signals='200d_new_hi,wallstreet_hi')
print(resp)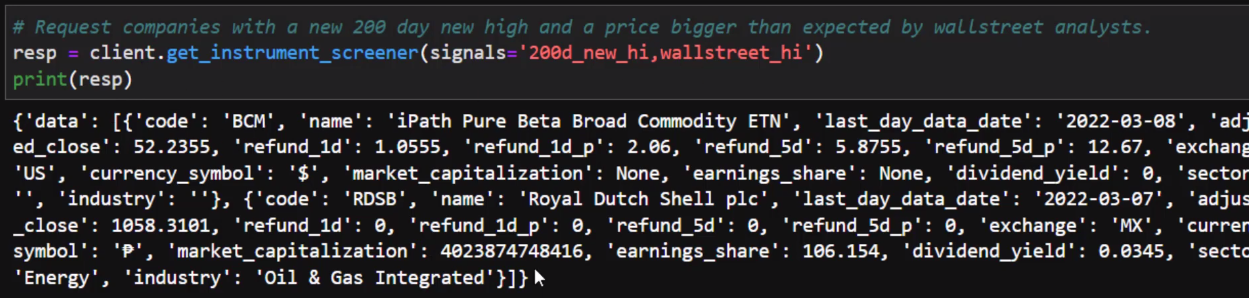
As you can see you could get a bunch of data back that shows which codes specify this requirement.
09:57 — SEARCHING API FOR STOCKS ETFS FUNDS & INDEXES OVERVIEW
With the searching api you can look for:
• Stocks
• ETFs
• Mutual Funds
• Indexes
based on a search parameter, to do that try get_search_instrument and with using the query string telstra an Australian Stock. After transforming that into a data frame, indexing by the code you can get a list of all the information with respect to the word telstra.
# Search instrument with the word .com
resp = client.get_search_instrument(query_string='telstra')
df = pd.DataFrame(resp)
df.set_index('Code', inplace=True)
df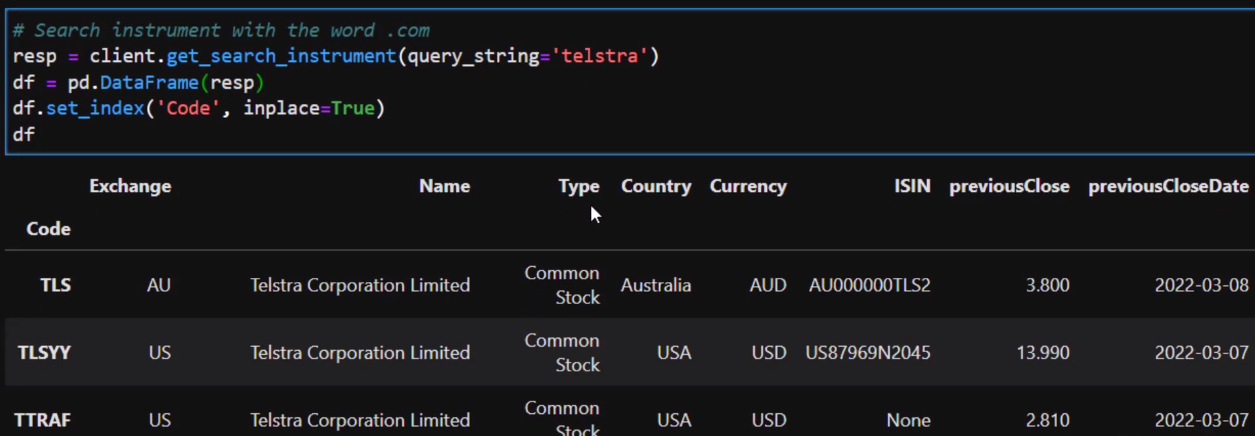
You can also use this ability to search other instruments. So for example if you only want to return bonds that are under that search query, then you can specify the string that you’re interested in with the limit=50 and then increase this to bonds_only=1 (true). By that way you’ll return only bonds with this specific search parameter:
# Search bonds related to USA
resp = client.get_search_instrument(query_string=’USA’, limit=50, bonds_only=1)
df = pd.DataFrame(resp)df.set_index('Code', inplace=True)
df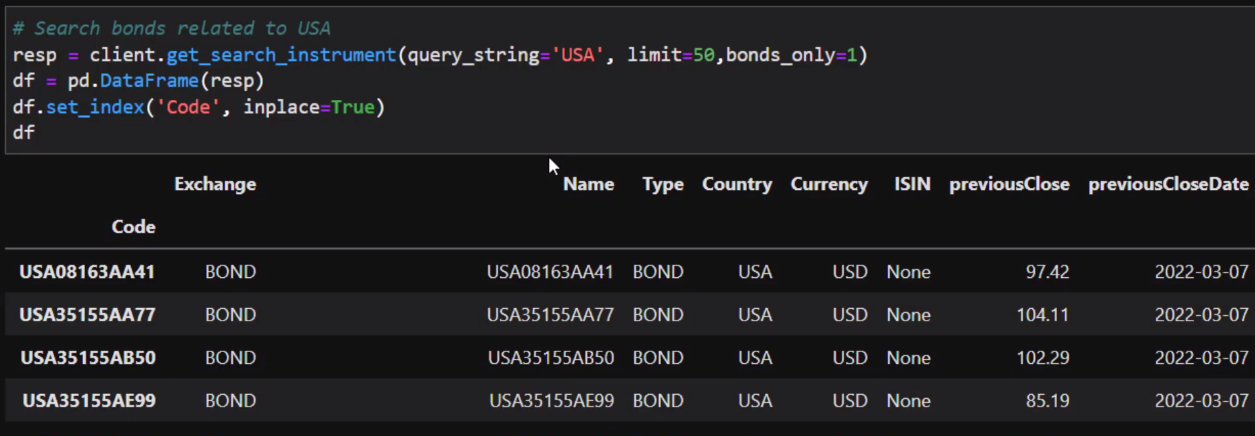
10:45 — CONCLUSION
So in summary the EODHistoricalData API in Python is extremely valuable you can get:
• Fundamental data
• Historical data
• Options data
• Real-time
• Intraday
• Historical splits
• Calendar information
• Technical Analysis
• Stock Screeners
So please go ahead and try and use this analysis for yourself.