Available with: All-In-One, EOD+Intraday — All World Extended packages.
Consumption: Each request consumes 5 API call.
Our application programming interface (API) provides technical data for equities, offering an expert-backed technical analysis API. Users gain access to a diverse range of indicators crucial for informed decision-making in the stock, crypto, forex markets. Explore our extensive list of all indicators in the stock market to improve your trading strategies and optimize your investment portfolios. Our API seamlessly integrates with various technologies, enabling users to leverage average industry standards and cutting-edge technology for advanced market analysis.
Technical indicators are integrated into our Google Sheets & Excel add-ons and in Python library already.
Quick jump:
- 1 Quick Start
- 2 Filter fields
- 3 Technical Indicator Functions
- 3.1 Split Adjusted Data
- 3.2 Average Volume (avgvol)
- 3.3 Average Volume by Price (avgvolccy)
- 3.4 SMA (Simple Moving Average)
- 3.5 EMA (Exponential Moving Average)
- 3.6 WMA (Weighted Moving Average)
- 3.7 Volatility
- 3.8 Stochastic Technical Indicator
- 3.9 Relative Strength Index (rsi)
- 3.10 Standard Deviation (stddev)
- 3.11 Stochastic Relative Strength Index
- 3.12 Slope (Linear Regression)
- 3.13 Directional Movement Index (dmi or dx)
- 3.14 Average Directional Movement Index (adx)
- 3.15 Moving Average Convergence/Divergence (macd)
- 3.16 Average True Range (ATR)
- 3.17 Commodity Channel Index (CCI)
- 3.18 Parabolic SAR
- 3.19 BETA
- 3.20 Bollinger Bands
- 4 Special Formats
- 5 Important Notes
Quick Start
To get technical indicators data for every equity we have in our data set, use the following URL:
https://eodhd.com/api/technical/AAPL.US?order=d&from=2017-08-01&to=2020-01-01&function=sma&period=50&api_token=demo&fmt=json
curl --location "https://eodhd.com/api/technical/AAPL.US?order=d&from=2017-08-01&to=2020-01-01&function=sma&period=50&api_token=demo&fmt=json"
$curl = curl_init();

curl_setopt_array($curl, array(
    CURLOPT_URL => 'https://eodhd.com/api/technical/AAPL.US?order=d&from=2017-08-01&to=2020-01-01&function=sma&period=50&api_token=demo&fmt=json',
    CURLOPT_RETURNTRANSFER => true,
    CURLOPT_ENCODING => '',
    CURLOPT_MAXREDIRS => 10,
    CURLOPT_TIMEOUT => 0,
    CURLOPT_FOLLOWLOCATION => true,
    CURLOPT_HTTP_VERSION => CURL_HTTP_VERSION_1_1,
    CURLOPT_CUSTOMREQUEST => 'GET',
));

$data = curl_exec($curl);
curl_close($curl);

try {
    $data = json_decode($data, true, 512, JSON_THROW_ON_ERROR);
    var_dump($data);
} catch (Exception $e) {
    echo 'Error. '.$e->getMessage();
}
import requests

url = f'https://eodhd.com/api/technical/AAPL.US?order=d&from=2017-08-01&to=2020-01-01&function=sma&period=50&api_token=demo&fmt=json'
data = requests.get(url).json()

print(data)
library(httr)
library(jsonlite)

url <- 'https://eodhd.com/api/technical/AAPL.US?order=d&from=2017-08-01&to=2020-01-01&function=sma&period=50&api_token=demo&fmt=json'
response <- GET(url)

if (http_type(response) == "application/json") {
    content <- content(response, "text", encoding = "UTF-8")
    cat(content)
} else {
    cat("Error while receiving data\n")
}
- AAPL.US consists of two parts: {SYMBOL_NAME}.{EXCHANGE_ID}, then you can use, for example, AAPL.MX for Mexican Stock Exchange. or AAPL.US for NASDAQ. Check the list of supported exchanges to get more information about stock markets we do support.
- api_token – your own API KEY, which you will get after you subscribe to our services.
- function – the function that will be applied to data series to get technical indicator data. The list of possible functions with additional parameters you get below.
- period – the number of data points used to calculate each moving average value. Valid range from 2 to 100000 with the default value – 50.
- from and to – you can use these parameters with format ‘YYYY-MM-DD’. For example, if you need to get data only from Jan 5, 2017 to Feb 10, 2017, you need to use from=2017-01-05 and to=2017-02-10.
- order – use ‘a’ for ascending dates (from old to new) and ‘d’ for descending dates (from new to old). By default, dates are shown in ascending order.
- fmt – the output format, could be ‘json’ for JSON and ‘csv’ for CSV output. The default value is ‘json’.
- splitadjusted_only – default value is ‘0’. By default, we calculate data for some functions by closes adjusted with splits and dividends. If you need to calculate the data by closes adjusted only with splits, set this parameter to ‘1’. Works with the following functions: sma, ema, wma, volatility, rsi, slope, and macd.
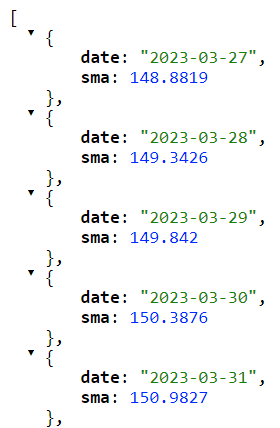
An example of output for SMA function for AAPL
Filter fields
We also support the ability to retrieve only the last value. Simply add ‘filter=last_ema‘ or ‘filter=last_volume‘ with ‘fmt=json‘, and you will receive only one number. For example, with this request:
https://eodhd.com/api/technical/AAPL?function=ema&filter=last_ema&api_token={YOUR_API_TOKEN}&fmt=json
curl --location "https://eodhd.com/api/technical/AAPL?function=ema&filter=last_ema&api_token={YOUR_API_TOKEN}&fmt=json"
$curl = curl_init();

curl_setopt_array($curl, array(
    CURLOPT_URL => 'https://eodhd.com/api/technical/AAPL?function=ema&filter=last_ema&api_token={YOUR_API_TOKEN}&fmt=json',
    CURLOPT_RETURNTRANSFER => true,
    CURLOPT_ENCODING => '',
    CURLOPT_MAXREDIRS => 10,
    CURLOPT_TIMEOUT => 0,
    CURLOPT_FOLLOWLOCATION => true,
    CURLOPT_HTTP_VERSION => CURL_HTTP_VERSION_1_1,
    CURLOPT_CUSTOMREQUEST => 'GET',
));

$data = curl_exec($curl);
curl_close($curl);

try {
    $data = json_decode($data, true, 512, JSON_THROW_ON_ERROR);
    var_dump($data);
} catch (Exception $e) {
    echo 'Error. '.$e->getMessage();
}
import requests

url = f'https://eodhd.com/api/technical/AAPL?function=ema&filter=last_ema&api_token={YOUR_API_TOKEN}&fmt=json'
data = requests.get(url).json()

print(data)
library(httr)
library(jsonlite)

url <- 'https://eodhd.com/api/technical/AAPL?function=ema&filter=last_ema&api_token={YOUR_API_TOKEN}&fmt=json'
response <- GET(url)

if (http_type(response) == "application/json") {
    content <- content(response, "text", encoding = "UTF-8")
    cat(content)
} else {
    cat("Error while receiving data\n")
}
You will get one value – the last EMA value for AAPL (Apple Inc).
Technical Indicator Functions
For all functions you can use the following parameters as described above: to, from, order and fmt. In addition, you should use function parameter, we described the specific usage for each function below.
Split Adjusted Data
It’s not a technical indicator itself, but we added this function to our API. By default Open, High, Low and Close values (OHLC) we provide in raw values and adjust neither for splits nor for dividends. While ‘adjusted_close’ values are adjusted both to splits and dividends. However, if you need only split-adjusted closes, you can use this function to get the desired time series.
API Parameters:
function [required] – splitadjusted.
agg_period [optional] – aggregation period. Default value – ‘d’. Possible values: d – daily, w – weekly, m – monthly.
Average Volume (avgvol)
This function returns the Average Trading Volume. The average volume of a security over a longer period of time is the total amount traded in that period, divided by the length of the period.
API Parameters:
- function [required] – avgvol.
- period [optional] – the number of data points used to calculate each average trading volume value. Valid range from 2 to 100000 with the default value – 50.
Average Volume by Price (avgvolccy)
This function returns the Average Trading Volume in currency. The average volume in the currency of a security over a longer period of time is the total amount traded in that period multiplied by the price of the security, and divided by the length of the period.
API Parameters:
- function [required] – avgvolccy
- period [optional] – the number of data points used to calculate each average trading volume value. Valid range from 2 to 100000 with the default value – 50.
SMA (Simple Moving Average)
This function returns the Simple Moving Average indicator. More information on Wikipedia SMA article.
API Parameters:
- function [required] – sma.
- period [optional] – the number of data points used to calculate each simple moving average value. Valid range from 2 to 100000 with the default value – 50.
EMA (Exponential Moving Average)
This function returns the Exponential Moving Average indicator. More information on Wikipedia EMA article.
API Parameters:
- function [required] – ema.
- period [optional] – the number of data points used to calculate each exponential moving average value. Valid range from 2 to 100000 with the default value – 50.
WMA (Weighted Moving Average)
This function returns the Weighted Moving Average technical indicator. More information on Wikipedia WMA article.
API Parameters:
- function [required] – wma.
- period [optional] – the number of data points used to calculate each weighted moving average value. Valid range from 2 to 100000 with the default value – 50.
Volatility
This function returns the Volatility, a statistical measure of the dispersion of returns for a given security or market index. More information on the Investopedia Volatility article.
API Parameters:
- function [required] – volatility.
- period [optional] – the number of data points used to calculate each weighted moving average value. Valid range from 2 to 100000 with the default value – 50.
Stochastic Technical Indicator
This function returns Stochastic values. More information on Wikipedia Stochastic Oscillator article.
API Parameters:
- function [required] – stochastic.
- fast_kperiod [optional] – Fast K-period, the default value is 14. Valid range from 2 to 100000.
- slow_kperiod [optional] – Slow K-period, the default value is 3. Valid range from 2 to 100000.
- slow_dperiod [optional] – Slow D-period, the default value is 3. Valid range from 2 to 100000.
The output:
This function returns K values and D Values.
Relative Strength Index (rsi)
This function returns the Relative Strength Index (RSI) technical indicator. More information on Wikipedia RSI article.
API Parameters:
- function [required] – rsi.
- period [optional] – the number of data points used to calculate each relative strength index value. Valid range from 2 to 100000 with the default value – 50.
Standard Deviation (stddev)
This function returns the Standard Deviation (stddev) technical indicator. More information on Wikipedia Standard Deviation article.
API Parameters:
- function [required] – stddev.
- period [optional] – the number of data points used to calculate each relative strength index value. Valid range from 2 to 100000 with the default value – 50.
Stochastic Relative Strength Index
This function returns Stochastic Relative Strength Index values. More information on Stochastic RSI Investopedia article.
API Parameters:
- function [required] – stochrsi.
- fast_kperiod [optional] – Fast K-period, the default value is 14. Valid range from 2 to 100000.
- fast_dperiod [optional] – Fast D-period, the default value is 14. Valid range from 2 to 100000.
The output:
This function returns K values and D Values.
Slope (Linear Regression)
This function returns the Linear Regression Slope. More information on Wikipedia Linear Regression article.
API Parameters:
- function [required] – slope.
- period [optional] – the number of data points used to calculate each weighted moving average value. Valid range from 2 to 100000 with the default value – 50.
The output:
Returns an array with calculated data or false on failure.
Directional Movement Index (dmi or dx)
This function returns the Directional Movement Index. More information on Directional Movement Index article.
API Parameters:
- function [required] – dmi.
- period [optional] – the number of data points used to calculate each weighted moving average value. Valid range from 2 to 100000 with the default value – 50.
The output:
Returns an array with calculated data or false on failure.
Average Directional Movement Index (adx)
This function returns the Average Directional Movement Index. More information on Average Directional Movement Index article.
API Parameters:
- function [required] – adx.
- period [optional] – the number of data points used to calculate each weighted moving average value. Valid range from 2 to 100000 with the default value – 50.
The output:
Returns an array with calculated data or false on failure.
Moving Average Convergence/Divergence (macd)
This function returns Moving Average Convergence/Divergence values. More information on Wikipedia MACD article.
API Parameters:
- function [required] – macd.
- fast_period [optional] – the default value is 12. Valid range from 2 to 100000.
- slow_period [optional] – the default value is 26. Valid range from 2 to 100000.
- signal_period [optional] – the default value is 9. Valid range from 2 to 100000.
The output:
This function returns MACD values, Signal values, and Divergence values.
Average True Range (ATR)
This function returns the average of true ranges over the specified period. More information on Average True Range Investopedia article.
API Parameters:
- function [required] – atr.
- period [optional] – the number of data points used to calculate each weighted moving average value. Valid range from 2 to 100000 with the default value – 50.
The output:
Returns an array with calculated data or false on failure.
Commodity Channel Index (CCI)
This function returns the CCI data. The Commodity Channel Index (CCI) is a momentum-based oscillator used to help determine when an investment vehicle is reaching a condition of being overbought or oversold. More information on Commodity Channel Index Investopedia article.
API Parameters:
- function [required] – cci.
- period [optional] – the number of data points used to calculate each weighted moving average value. Valid range from 2 to 100000 with the default value – 50.
The output:
Returns an array with calculated data or false on failure.
Parabolic SAR
This function returns the Parabolic SAR values. More information on Parabolic SAR Wikipedia article.
API Parameters:
- function [required] – sar.
- acceleration [optional] – Acceleration Factor used up to the Maximum value. Default value – 0.02.
- maximum [optional] – Acceleration Factor Maximum value. Default value – 0.20.
The output:
Returns an array with calculated data or false on failure.
BETA
This function returns the BETA values of any ticker against any other ticker, for example, any index like S&P 500. More information on Beta (Finance) Wikipedia article.
API Parameters:
- function [required] – beta.
- code2 [optional] – Any ticker code for calculating Beta value. Default value – ‘GSPC.INDX’.
The output:
Returns an array with calculated data or false on failure.
Bollinger Bands
This function returns the Bollinger Bands technical indicator. A type of statistical chart characterizing the prices and volatility over time of a financial instrument, using a formulaic method propounded by John Bollinger in the 1980s. More information on Wikipedia Bollinger Bands article.
API Parameters:
- function [required] – bbands.
- period [optional] – the number of data points used to calculate each weighted moving average value. Valid range from 2 to 100000 with the default value – 50.
The output:
Returns an array with calculated data or false on failure.
uband – ‘upper’ band.
mband – ‘middle’ band.
lband – ‘lower’ band.
Special Formats
Amibroker File format
This file format returns the data in AmiBroker File format to import the data into AmiBroker software.
API Parameters:
- function [required] – format_amibroker.
The output:
The AmiBroker file format to import the data into AmiBroker software. The example of the output can be seen here:
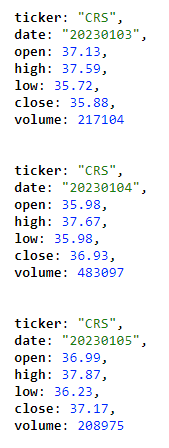
The OHLC fields are split-adjusted only, not adjusted to dividends.
Important Notes
Explore our marketlpace for more technical indicators.
Please note that each API request for Technical API consumes 5 API calls.
We continuously develop new indicators and can accommodate additional ones upon request. Feel free to contact us on our forum or via support@eodhistoricaldata.com.